Issue 35
At the Margin
There is no question that the cost containment achieved by the industry over the past few years has largely come to an end, and that costs are now clearly in an up-trend. In previous research we have offered the view that companies were beginning to slip in their efforts to hold the line on costs.

Figure 1
We have, in fact, been surprised at how quickly events have conspired to overwhelm the sector’s cost-containment programmes. The cost benefits brought on by currency weakness have now been largely erased, while even the gains achieved by closing old operations have come to naught. Moreover, we have begun to see the effects of a maturing asset base on a number of companies.
What Goes Up…
While it has become fashionable to blame the impact of currencies – certainly a factor in South Africa – other factors are decidedly at play. Fuel costs have risen, as have power costs. Labour costs will rise in H2 2004 in South Africa with the new labour contract (see below) coming into effect. Steel costs and reagent costs are also on the rise, primarily due to rising energy costs.
We have previously underestimated the extent to which sector costs would rise. The appreciation of the South African rand and the Australian and Canadian dollars have put upward pressure on costs. However, this cannot be the only explanation for the increase. We believe that pent-up expenditures, put on hold during the period of low prices, are also responsible for this trend. For example, at the beginning of 2002 we were estimating an industry average cash cost of $144/oz for the senior producers. By mid-2002 we had raised our estimate to $159/oz, while the actual figure for the year was$165/oz.
In South Africa, the 2003 wage negotiations with the NUM and other unions are having a dramatic effect in 2004. At the time, a wage increase of (on average) 7% for 2004 was considered a victory for industry, given that the 2003 wage settlement was about 10%, while inflation was slightly higher than that. In other words, the sector was giving below-inflation raises, continuing the industry’s historic trend. When coupled with the anticipated depreciation of the currency, the net effect was expected to be negligible. Unfortunately, inflation in South Africa today is in the range of 3-6% (and HSBC estimates that they could even come in below the bottom of the estimated range) and the rand has strengthened, making this year’s wage increases expensive in real terms.
Figure 1 tracks the trend in industry costs for the past few years. After declining dramatically in the period 1999-2001—both in response to the lower gold price and as a result of weakening currencies—costs have risen every year since.
It is our view that the gold price has risen primarily as a result of the weakness of the dollar. Figure 2 illustrates the important role that currencies have played over the past few years. Unfortunately, the weakness in the USD has translated into strength in other currencies, among them the South African rand and the Australian dollar. The price of gold (in USD terms), industry costs, and these two key currencies declined with the fall in the US currency and are now rising in tandem.

Figure 2
Cash and Total Costs
Figure 3 summarises our estimates of the cash costs, total costs, and realised prices for the gold industry for the years 2003-2005.We estimate that the industry’s cash costs for 2004 will average $224/oz, increasing to $232/oz in 2005.Total costs are forecast to average$285/oz this year and $292/oz next year.
It should be noted that we have changed the way in which we calculate the cash costs or Freeport. Previously, we stuck to the letter of the law and used the Gold Institute standard for all the companies. In the case of Freeport, this led to significant distortion, given the company’s high copper by-product credits. Including Freeport had the impact of understating the sector’s costs, while excluding it had the opposite effect. We have decided that using co-product accounting for Freeport is more representative and have calculated the company’s costs on that basis.
Also note that the inclusion of Freeport-McMoRan tends to lower the average costs for the group. Using the Gold Institute cash cost standard, the company reports negative cash costs after copper by-product credits.
Based on the old methodology, we estimated that the sector’s cash costs in 2004 would be in the range of $216/oz (including FCX) to $219/oz (excluding FCX). With the new approach we are estimating sector costs of $224/oz. This probably has more to do with rising cost pressures than it does with the actual change in the approach.
Incidentally, we are getting feedback from more and more institutions that believe that the industry ‘cash costs’ are a misleading figure, and that ‘total costs’ are a better indicator. We couldn’t agree more. Total costs for 2004 are estimated at $285/oz. This is a$4/oz increase with respect to our February estimate. For 2005, we are estimating total costs for the sector of $295/oz.
Figure 4 summarises the wide differential in cost margins for the largest companies in the gold industry, based on HSBC’s 2004 estimates.
Despite the market’s ongoing angst with hedging, the practice is, for the most part, having a relatively minor impact on the industry. We estimate that the sector will realise an average gold price of $396/oz in 2004, relative to our average estimate of $404/oz. In other words, the industry as a whole is leaving $8/oz on the table as a result of its hedging activities.
For 2005, we are estimating an average industry realised price of $412/oz, against a gold price forecast of $430/oz, for a net ‘loss’ due to hedging of $18/oz. Since the industry has been taking advantage of price dips to reduce exposure, we fully expect that the net impact of hedging could be even lower.

Figure 3
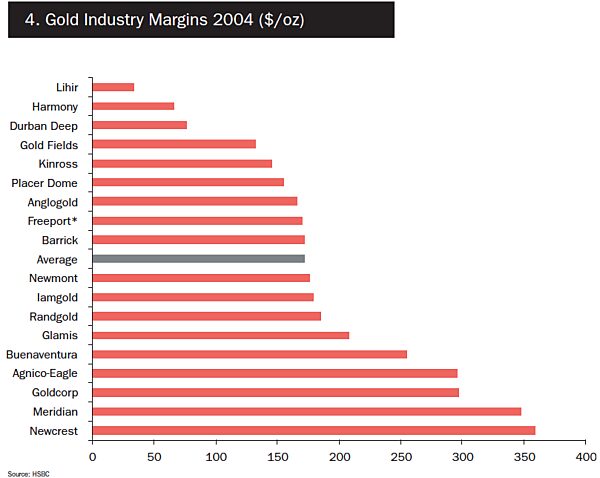
Figure 4
Eroding Margins
Figure 5 tracks the estimated change in costs for 2004 and 2005 with respect to 2002. On average, we expect the sector to experience an increase in cash and total costs of $59/oz and 69/oz, respectively, in 2004 with respect to 2002. Given the anticipated increases expected for 2005, we estimate that the change with respect to 2002 will increase to $67/oz for cash costs and $76/oz for total costs.
The largest increases in costs are generally in South Africa, although there are exceptions. Randgold Resources, for example, is experiencing an increase in costs only because of the extraordinarily low costs experienced in 2002. Lihir, although not South African, shares one important trait with its South African peers: a very high fixed-cost base.
At the other end of the spectrum are companies like Newcrest and Agnico-Eagle, which have benefited from a significant improvement in base metal credits. Meridian’s costs have declined due to the sale of the Jerritt Canyon mine, but when one compares the trend in cash costs at its remaining asset, El Peñón, there has been no appreciable increase. The same can be said for Buenaventura, where costs have not increased.
The average increase in cash costs of$59/oz has obviously eaten into the industry’s margins. We are forecasting an average gold price of $404/oz in 2004, compared to an actual average of $310/oz in 2002.This means that of the average increase in the gold price of$94/oz over the past two years, only $35/oz have flowed to the bottom line. When we factor in the impact of hedging, margins have improved even less. We estimate that the sector realised an average gold price of $317/oz in 2002, which implies a cash margin of $165/oz. For 2004, we estimate the industry will achieve an average price of$396/oz, against a cash cost of $224/oz, for a margin of $172/oz. Thus, the actual margins for the sector have improved by only $13/oz over the past two years.

Figure 5
Industry Cost Curve
Figure 6 presents a composite cash-cost curve (using total cash costs) for the senior gold producers based on our 2004 production and cost forecasts (all adjusted to a 2004 calendar year). We have included Freeport’s cash costs using the co-product methodology.
We continue to see little in the way of cost differential among the largest producers, with the exception of the South Africans, which continue to be weighted towards the high end of the cost curve.
The only companies remaining at the lowest end of the curve are, primarily, single-asset companies. These include Meridian with El Peñón, Goldcorp at Red Lake, and Randgold at Morila. Buenaventura is, however, an exception. Yanacocha is a low-cost producer, but so are the company’s other assets. Also, an exception are Agnico-Eagle and Newcrest, although this is largely due to the impact of by-product copper credits. The middle of the cost curve is dominated by the most geographically diversified, largest producers: Barrick, Newmont and Placer Dome. The most expensive producer is Lihir which, as mentioned, has a high fixed-cost base (and has had unexpected process plant problems).
Currency, Energy, Labour –Challenge or Opportunity?
While the culprits have been various –currencies, labour, fuel, energy, steel, reagents – the most important question, what should the industry do about this? remains unanswered.
Unfortunately, the answers are neither easy nor pleasant. If the gold price is indeed being driven by weakness in the dollar, then future increases in gold will come, as they have in the past three years, with increasing costs. Thus, the only effective, short-term means of protecting the industry’s margins may be to consider currency hedging.
Considering the efforts, the industry has made, and continues to make, to eliminate the vestiges of gold hedging, this may sound like apostasy to most readers. The other alternative, albeit more long-term in nature, is to diversify the portfolio. Acquiring and/or developing assets in the so-called “non commodity” countries would diversify country risk and potentially create a portfolio with less currency exposure.
With respect to energy prices, the same unpleasant answer – hedging – immediately comes to mind. As unpleasant as that may sound, there is no efficient way of diversifying away the impact of rising energy costs. Rising labour costs can only be managed by attempting to tie compensation to productivity, but as we know this is sometimes very difficult in many jurisdictions. Companies have made inroads by re-assessing how they manage their procurement practices, using software to manage their inventories, enhancing their maintenance practices to extend the lives of their equipment, and by centralising certain management functions.
These initiatives can shave a few dollars off the industry’s production costs, but the battle will be won, or lost, on three fronts: currency, energy and labour. Those companies that can effectively reign in this triple threat – whether by management savvy or by virtue of the location and quality of their assets – will become the industry leaders in the next few years.
Victor Flores is Senior Mining Analyst at HSBC, where he is responsible for research and analysis of North American and Australian precious metals producers. He is also coordinator and editor of HSBC’s global sector research. Victor is a CFA whose previous experience includes portfolio management and research analysis. His professional memberships include the Association for Investment Management and Research and the Society of Mining Engineers.