Issue 74
After the Gold Crash
What caused last spring’s historic crash is less important now than how it has changed our market since. Gold prices fell 30% across 2013, yet squeezed nearly all that drop into Q2 alone and achieved almost half of it in two days in April. Such violence unleashed Asian bargain-buying, needed to match Western selling...

Spring 2014 marks several anniversaries for the bullion market – 60 years since the resumption after World War II of London’s daily fixings for instance, or three years since silver touched $50 per ounce for the second time ever, and ever so briefly again. Gordon Brown’s ham-fisted announcement of UK gold sales in May 1999 still captivates public memory in the UK. But perhaps our market’s biggest anniversary this spring should also be a first. Because it marks one year since the historic crash in gold and other precious metals prices starting in mid-April 2013.
Goldman Sachs had advised clients to short gold early that week. Cyprus was told to sell gold on Thursday by the EU and IMF. Gold prices fell into London trade on Friday 12 April, dropping as the market closed for the weekend through $1,530 per ounce – the previous 18 months’ low – only to slump another 3.5% by the time New York trade ended. Then on Monday the real trouble showed up. Fellow members need no reminding (and most will want it still less). But the way last year’s crash unfolded, and how it altered demand worldwide, deserves study. Because whether those changes now prove permanent looks critical to our market. The crash also highlighted unique features, most plainly in gold, which may prove more lasting.
Across last year as a whole, gold prices fell some 30% – the same amount US equities returned to investors in total. Yet gold squeezed almost all of 2013’s drop into the second quarter alone, down 25.4% in dollar terms, and half of that was achieved in just those two days in April. A second slump to $1,180 per ounce then marked gold’s low of the year, hit on the last trading day of June and again on New Year’s Eve. Prices have essentially been flat for 12 months now, closing between $1,200 and $1,400 on a monthly basis. Viewed as a market reset, therefore, gold’s drop was swift and successful. Because while the slump was in fact finished by midsummer, the wrenching loss in Q2 forced Western sellers, whenever they then sold, to accept the discount prices needed to unleash bargain buying from Asia in particular. The surge in consumer demand for gold jewellery, bars and coins very nearly matched the outflows from exchange-traded trusts and other investment vehicles. But this extra demand wasn’t for the securitised form those investments took. Nor was it local to where their underlying bullion was held.

Unique amongst major asset classes, physical gold enjoys a diverse set of buyers worldwide, with very different motives. Industrial use accounts for around 10% of annual demand, proving highly inelastic in tonnage terms over the last decade based on Thomson Reuters GFMS data, despite the 300% swing in annual average prices. All other demand broadly splits between jewellery and investment, but within those categories lie many different markets with very different behaviours, some of which were extended by spring 2013’s price crash, while others briefly reversed. To supplement supply and demand tonnages, Figure 1 below shows interest in buying gold amongst internet users in the USA and India. Google Trends shares search volume data as a proportion of all queries on the search engine, rebasing peak interest to 100. Measuring searches for ‘buy gold’ in English shows that both Indian and US consumers usually have much more pressing concerns, whether ‘Miley Cyrus’ or ‘Shilpa Shetty’. But mapped against the gold price, spikes in that query confirm that, for public interest in buying gold to become most urgent, the US needs rising prices, while India prefers a discount. Added urgency came in spring 2013 because the Indian government was accelerating its moves to the current de facto ban on legal imports. Levels of interest in the US also spiked, and full-year household demand for gold bars and coins did rise by weight from 2012 according to Thomson Reuters GFMS data (see Figure 2). But as a proportion of all Google searches, ‘buy gold’ in the US reached only three-quarters of its summer 2011 peak, and full-year demand lagged the 2008-2011 average by almost one-third in tonnage terms, despite the price drop.

India’s world-leading private consumption, in contrast, hit record levels in 2013, leaping so fast on April’s crash that the government finally brought down the shutters, hiking import duty to 10% and then imposing the ‘80/20 rule’, which forces dealers to re-export 20% of any new shipment before taking delivery. Smuggling has clearly solved that riddle, but as the grey market doesn’t hit the official Current Account Deficit, the ban has helped the rupee to recover on the FX market at the cost of hurting India’s legal gold industry. China’s gold demand meantime rose faster still, finally taking over from India as the world no.1 and swallowing well over 1,160 tonnes of imports based on official data, even while continuing to top the league table of gold- mining nations with a further 440 tonnes of supply. Looking at retail bar and coin purchases (see Figure 2), China accounted for 30% of the 2013 jump in global demand, pushing it to new highs both in tonnes and compared against full-year supply. China also accounted for almost half the growth in world jewellery consumption, another new record. But for all that additional Asian consumer demand, it failed first to stem or then reverse last spring’s crash.
Much has been written about Western investment funds exiting gold in 2013. Their changed view as the year began clearly prepared the ground for Q2’s drop – a mix of boredom, greater allocations to equities, and not wanting to be last out the door, even as Western households regained their strongest interest in gold since 2011, briefly aping a more ‘Asian’ response to the drop. The thinking of money managers going into and during the financial crisis, however, with its concomitant peak in the gold price, looks hard to split from broader public sentiment, especially amongst higher earners (see Figure 3). Opinion-poll specialists Gallup only added gold to its menu of ‘best long-term investments’ in 2011, and only then in what seems an urgent survey as prices broke through $1,900 per ounce that August. (Previous and subsequent surveys were conducted each April, each again of around 1,000 respondents.)
While gold’s popularity has ebbed since then on Gallup’s surveys, it has ceded first place only to real estate, and that headline rate itself belies gold’s continued top ranking amongst the two lower, much larger income categories that the pollsters apply. This highlights ongoing but untapped (and perhaps merely wishful) demand for investment gold amongst US households, at least as far as opinion polls go.

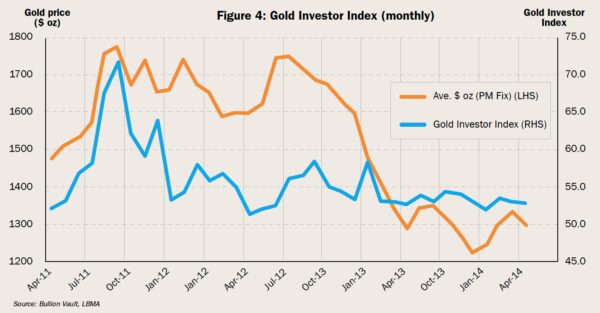
What then of actual private investor behaviour in the West? Again, to supplement the available tonnage data, our Gold Investor Index gauges the number of people who grew or reduced their gold holding using BullionVault each month, as a proportion of all existing gold owners at the start (see Figure 4). As the largest provider of vaulted gold ownership online, with 52,000 users primarily in the Eurozone, UK and North America, we believe the index offers a useful window onto Western household investment activity and sentiment. Rebased so that 50 shows a perfect balance of net buyers and sellers, the Gold Investor Index spiked in April 2013 to the highest reading since the end of 2011, reminiscent of India and China’s response. While that initial bargain-hunting surge wasn’t repeated during the June crash, and while the index then retreated to an 18-month low as gold prices flattened into New Year 2014, the index has remained above 50 throughout, signalling a positive balance of net buyers over sellers. However, total client holdings on BullionVault haven’t quite recovered spring 2013’s liquidation by weight, ending April 2014 some 0.1% shy of March 2013’s 33.0-tonne total. So the actual behaviour shown on our index perhaps supports the income- category numbers from Gallup’s poll, with larger investors who took refuge in gold during the financial crisis reducing their allocations as investors now building their savings make sure they include physical bullion. This extended lull in gold price volatility offers newer entrants the chance to build their holdings quietly.
Anecdotally, from speaking to BullionVault users as well as competitors in retail bullion, it would indeed seem that the financial crisis peaking in 2011 looms larger than the precious metals crash of spring 2013. That is just as it should be. Gold remains the best-performing major asset class of the last 10 years. Although it was gold’s worst calendar quarter on record, April- June 2013 was not its worst 90-day drop. That came in spring 1980, when prices fell over 40% from gold’s $850 top. Nor was spring 2013’s gold crash as dramatic as the most recent slump in US equities. The Lehman’s collapse of autumn 2008 proved harsher even than the worst 90-day drop around Black Monday 1987, knocking nearly 30% off the Dow Jones Industrial Index. So one surprise from spring 2013 may be that gold prices didn’t fall further. Because unlike exchange-traded contracts, physical bullion has no circuit breakers, no daily price-move limits or ‘stop logic’. Yes, the CME applies the latter to gold and silver futures contracts, and several such pauses in Comex trading were triggered last spring. The CME is now considering daily price limits, too. But the intraday movements of last April’s crash were smallest during London hours, when the vast bulk of business is conducted directly between buyer and seller ‘over the counter’ (OTC) rather than via an order-matching exchange with a centralised clearing house. Moving 5.3% on Friday 12 April from its high to the low on the spot-month futures contract, gold moved only 0.8% from the am to pm fix in London. The following Monday, the am to pm London fix moved 1.5% versus a high-low swing of 10.7% in the spot-month future. Contrast this with the failure of OTC credit-derivative markets during the financial crisis. Whatever regulatory (or legal) pressure comes to bear on the fix, or on London’s principal-to-principal market, these pre-digital mechanisms plainly offered a welcome point of deep liquidity to buyers and sellers alike during spring 2013’s volatility.
Another challenge to London’s dominance in bullion dealing post-2013 looks more fundamental. The spike in Chinese and Indian premiums over and above London prices, caused by the crash and the demand it released, incentivised a massive shift in the world’s tradable stockpiles out of UK storage through Swiss and Middle East refineries and onto Asia. Spring 2014 has now found China oversupplied, with Shanghai gold offered at a rare discount to the world’s benchmark of London settlement. Provided China’s private appetite for gold holds firm – and does not reverse – then lower volatility would look a likely result for all participants, as the Shanghai arbitrage becomes part of the world price. The prolonged if slight ‘London premium’ of February to May 2014 may signal the start. China is after all the world’s no.1 miner, consumer and importer. We don’t yet know how the world’s heaviest gold demand will react to a slump in household income or savings. But with China now deeply plumbed into the global economy, the tide of debt defaults now lapping at its $7.5 trillion shadow banking industry could hit capital markets worldwide. The West’s financial crisis showed that scared money, big or little, buys gold. The metal’s huge outperformance across the last decade says the smart money buys gold in advance.
Adrian Ash, Head of Research, BullionVault
Adrian Ash has been Head of Research at BullionVault since 2006. Formerly Editorial Chief at the UK’s largest publisher of private-investor advice, and also City Correspondent for the popular Daily Reckoning email, he is now frequently quoted by leading news outlets worldwide.